
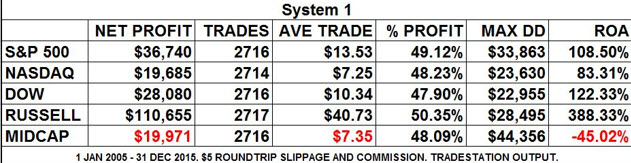
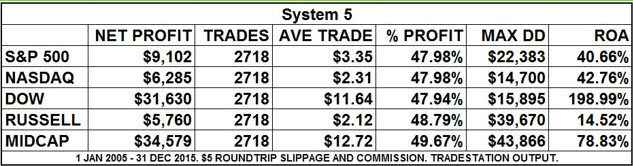
The above table shows the results of a moronically simple mechanical trading system. It’s taken off daily charts, day sessions only. Every trade involves entering a long or short at the 8:30 Central Time regular session open, and exiting at the 3:15 p.m. close. You get one signal per market nearly every day.
The field of study spans January 2, 3005 through the end of 2015. Each trade is docked $5 for slippage/commission, so those average trade figures in column 3 are over and above that. Study the various aspects. Note that the average percent is just under 50. There are over 10,000 trades total, so we don’t have to question the statistical validity. The drawdowns–decrease in your account during the system’s worst period–would be impossible for most of us to endure. The ROA or return on account is the percent your account would have increased had your initial startup been equal to the worst drawdown. Among the many stats one could focus on, this is the one I assign the most significance. How much pain did you have to endure to make the ultimate $110,655 in the Russell? $28,495 worth. If you had deep pockets and unshakable resolve, your ultimate $110 thousand would have been a 388 percent increase of your (worst drawdown) startup.
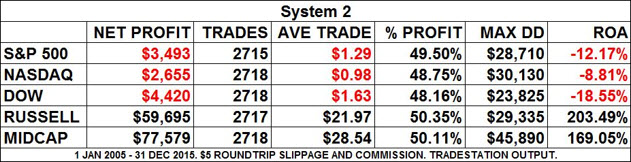
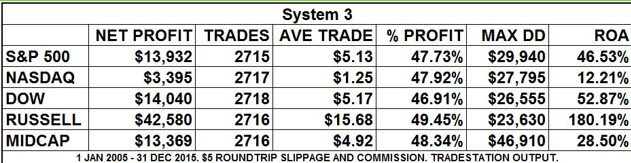
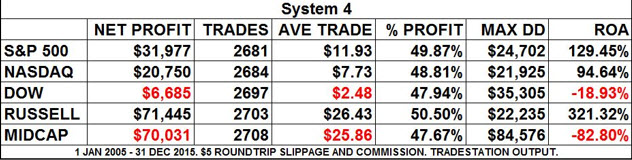
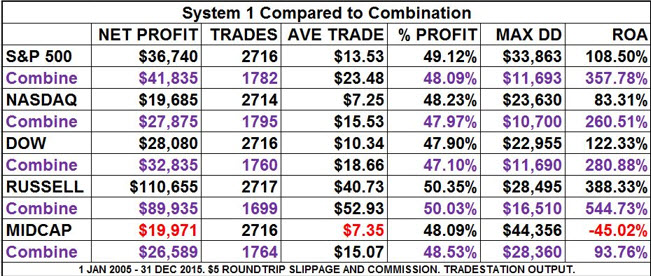
Now. take a few moments to examine Systems 2-5 in the following tables. Note the strongest/weakest markets in each. They tend to occur in different places. A weakest market under one system might be the strongest in another. What if we could combine the signals so that the ride becomes smoother across the board? What if doing so decreased the drawdowns and increased the return on accounts? What if there were now winners across the board? This is part of what I advocate publicly and apply to my own trading. By combining simple biases, you can produce sums that are greater than the original parts.
The following table, “System 1 Compared to Combination,” shows an example of the above proposition. The first system(in black) is left in for comparison’s sake, but it could have been any other the other four. The purple type shows combining the five buy/sell indicators. The buy signals were assigned a +1 value, the sells, -1. You had to have a +2 or greater value to enter a long on the next opening. For shorts, the reading had to be -2 or less. With this threshold, we’ve filtered out a number of trades, so we shouldn’t be surprised if the net profit doesn’t climb significantly, or even if it decreases. What we’re mainly interested in is the ratio of risk to reward, best reflected in the return on account. Not that that figure is higher in all five markets. Note also that the worst drawdowns have decreased by nearly half at least.
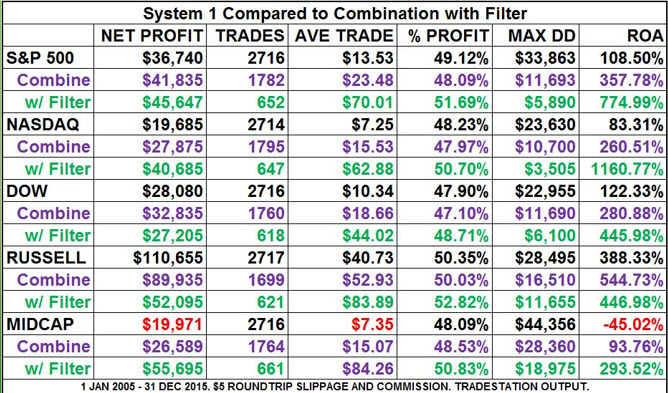
Now let’s add one final filter related to volume. Again, we’re weeding out more trades but look what happens to our ratios (green). The worst you would have done over the 11 year time frame would be in the Midcap–just shy of a 300 percent ROA. The Nasdaq registered an astounding 1160 percent account increase. Three out of the five drawdowns are now well under $10,000. Despite the weeding, the net profit itself reached new highs in the S&P and Nasdaq.
And no, you’re correct, I’m not handing you free how-to system instructions here, but like the old “hand a man a fish–teach a man to fish” parable, hopefully you’re gaining a good takeaway for your own research. By combining small simple biases, it is possible to get a whole far in excess of the sum of its parts.